Our Impact
Dyme Impact Results
5.5 MW of solar built and operating, with 20 MW more in the pipeline — powering communities, cutting emissions, and lowering electricity costs.
5.5 MW
Solar built & operating
Plus 20 MW more in the pipeline
7,807 MWh
Clean energy produced per year
Powers 710 homes for 30 years
5,910 t
CO₂ avoided annually
Grid factor: 0.757 tCO₂/MWh (CEA v20.0)
177,300 t
Lifetime CO₂ avoided over 30 years
What Do 5,910 Tons of CO₂ Look Like?
Each year, our projects avoid emissions equivalent to what ~271,000 mature trees would absorb. That's the same as 15 Central Parks.
~271,000
Mature trees' worth of CO₂ absorbed each year
15
New York Central Parks of mature forest
9,600
Football fields of mature trees
Three Steps to Clean Energy
You Book Travel
Search and book from over 2 million hotels and 600 airline partners at member-only rates.
Dyme Funds Projects
A portion of every booking goes directly toward funding solar projects on schools and hospitals.
Communities Benefit
Schools and hospitals get cheaper, cleaner electricity — savings they can redirect to jobs and services.
5.5 MW
Capacity
~7,800
MWh/Yr
~5,900
tCO₂/Yr
~135
Job-Years
43%
Lower Costs
≈270K
Trees Equiv.
≈15
Central Parks
How We Choose Projects
Every project is evaluated against six pillars to ensure maximum climate and community impact per dollar invested.
01
Additionality
We only invest in projects that add new renewable capacity to the grid — genuine climate progress, not ownership transfers.
02
Financial Strength
Capital directed to projects with the highest climate and community impact per dollar — cost-effective builds that maximize clean electricity.
03
Technology Maturity
Panels, inverters, and components are evaluated for durability, efficiency, and responsible sourcing to ensure long-term performance.
04
Energy Production
Projects prioritized in high solar irradiance locations — more sunlight means more clean electricity generated over the project's lifetime.
05
CO₂ Avoided per Dollar
Not all grids are equal. We target regions where renewables displace the most coal and oil, maximizing emissions reduction per investment.
06
Community Value
Beyond emissions — renewable projects cut electricity bills by over 30% for schools, hospitals, and households. Savings go to jobs, education, and healthcare.
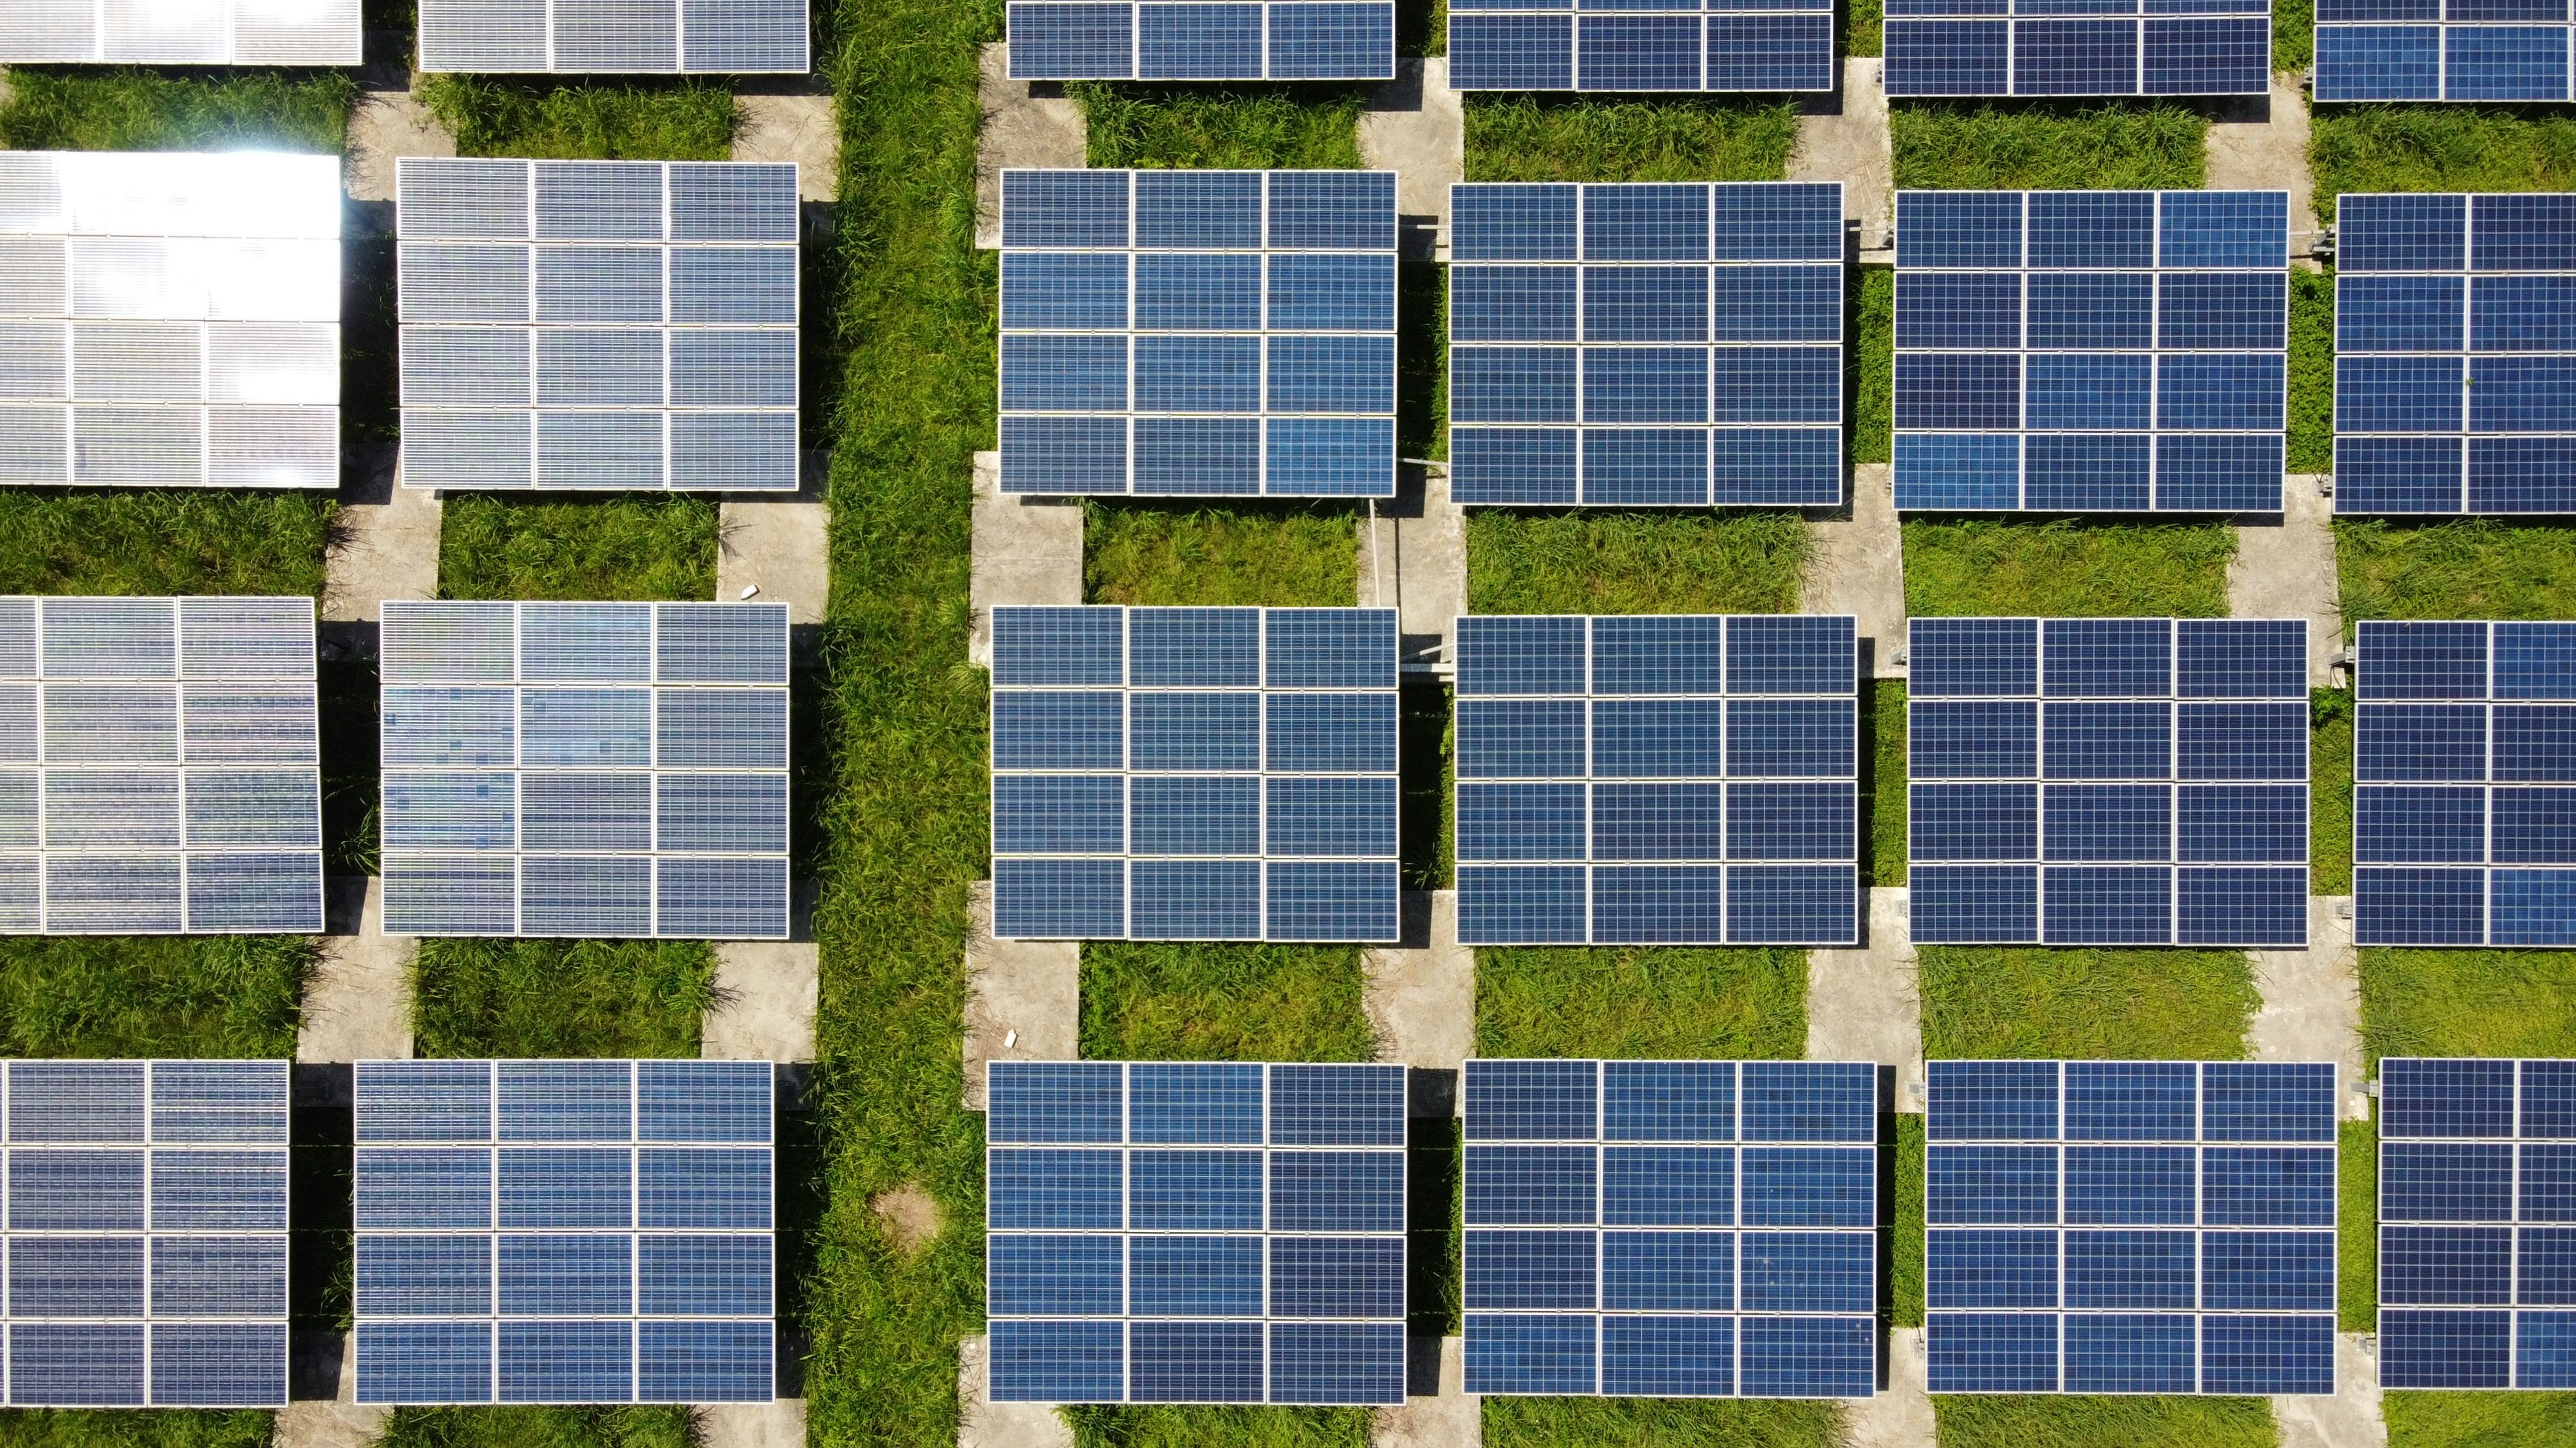
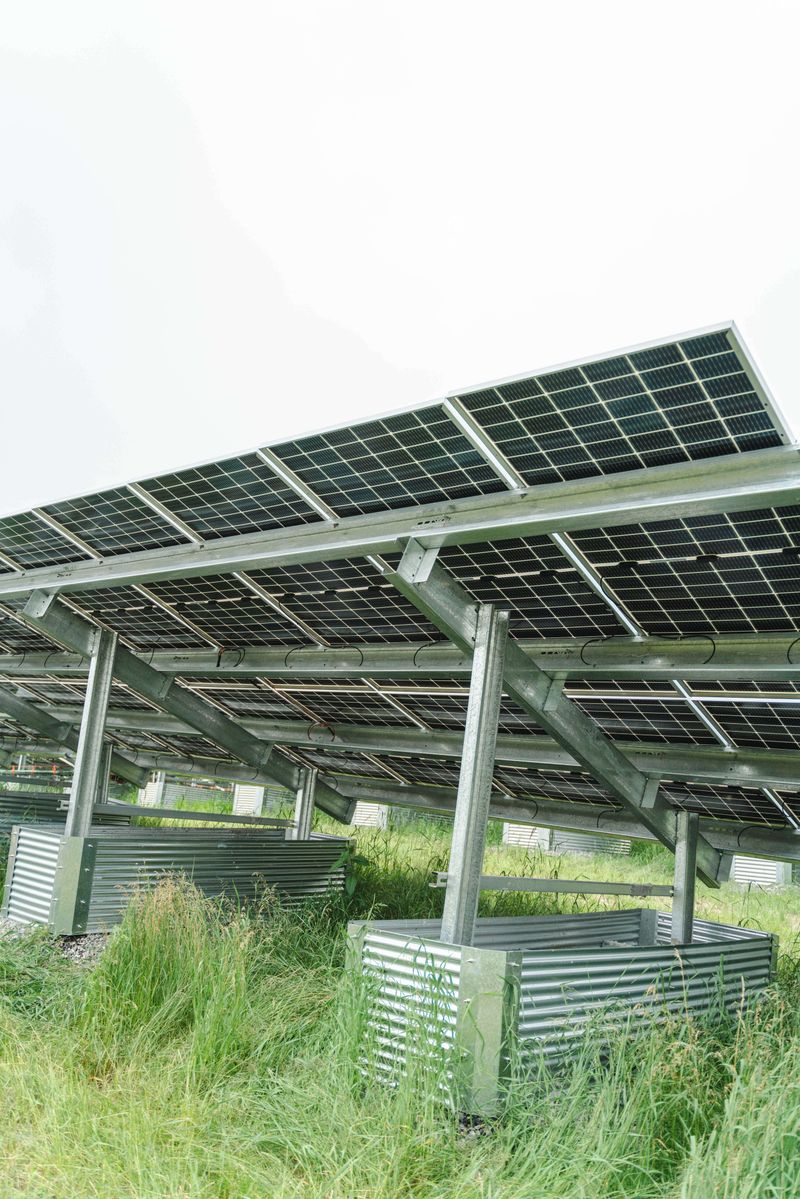
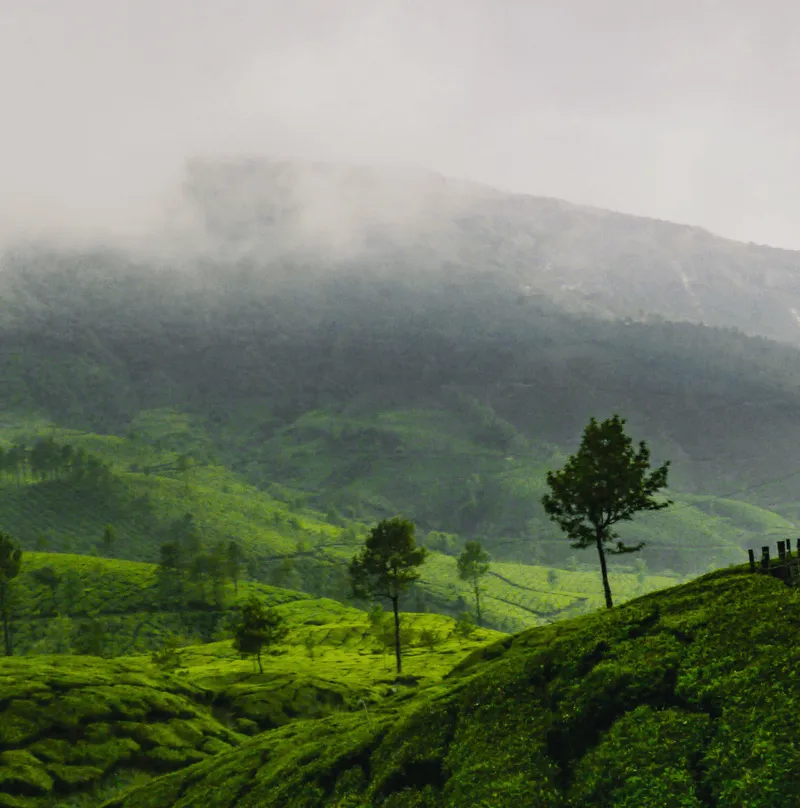
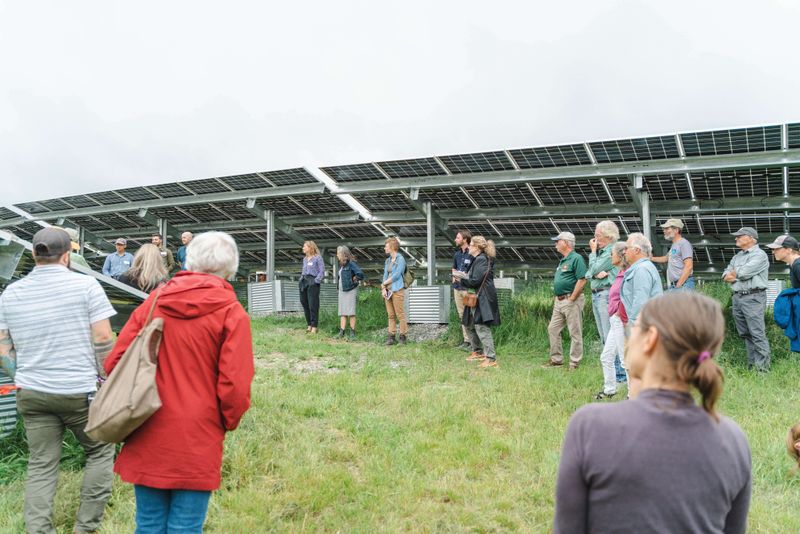
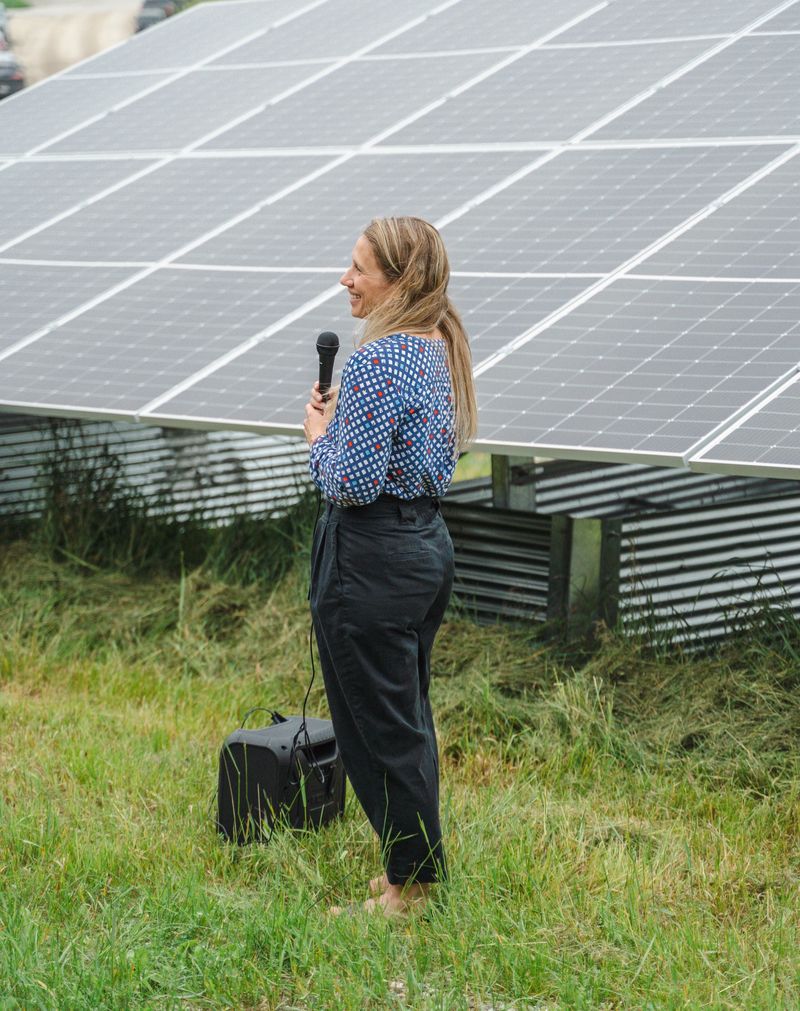
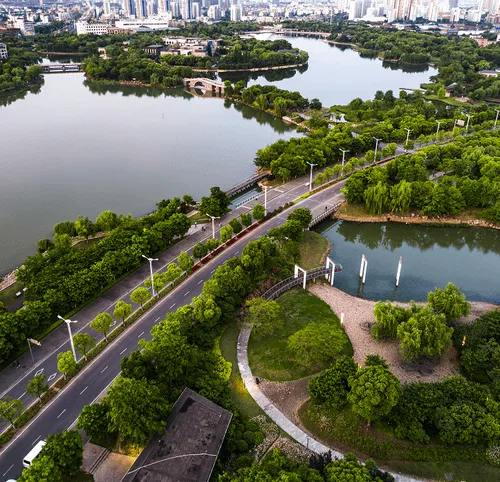
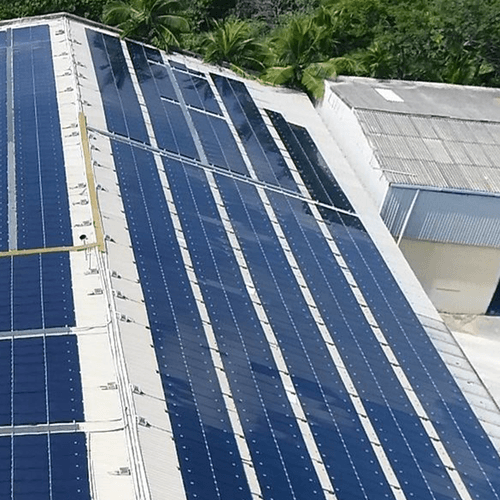
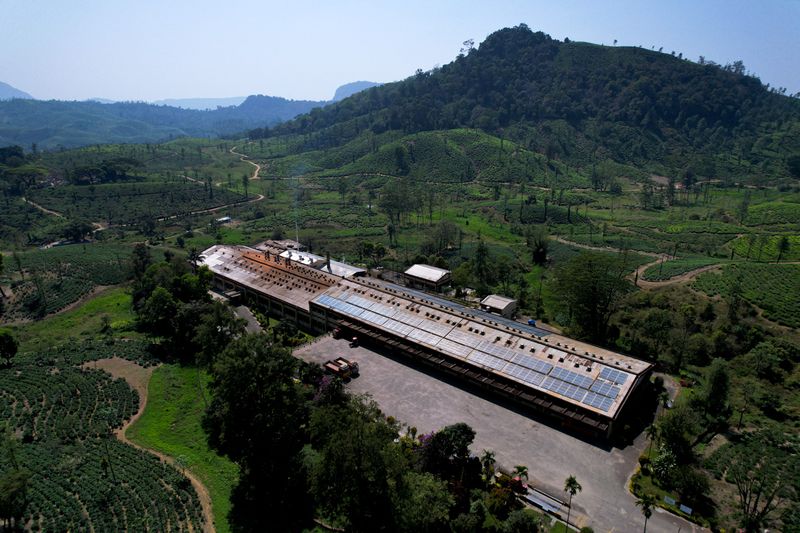
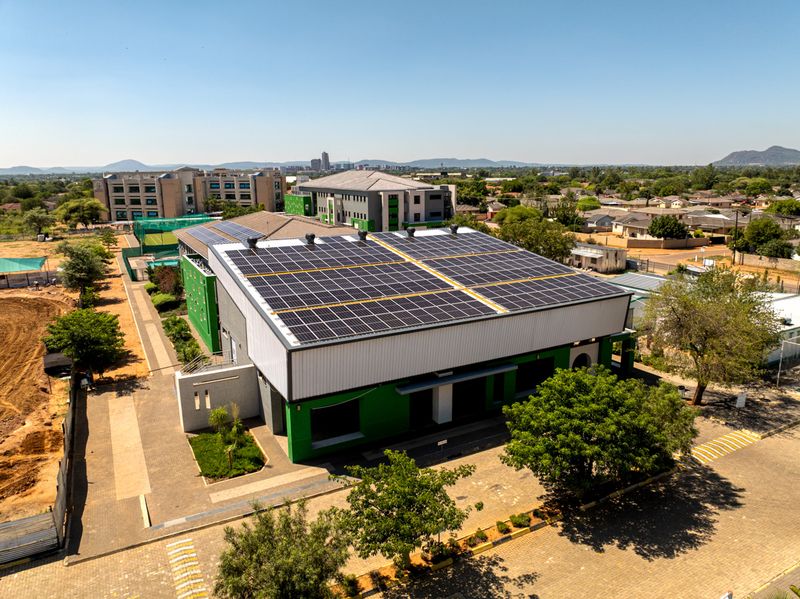
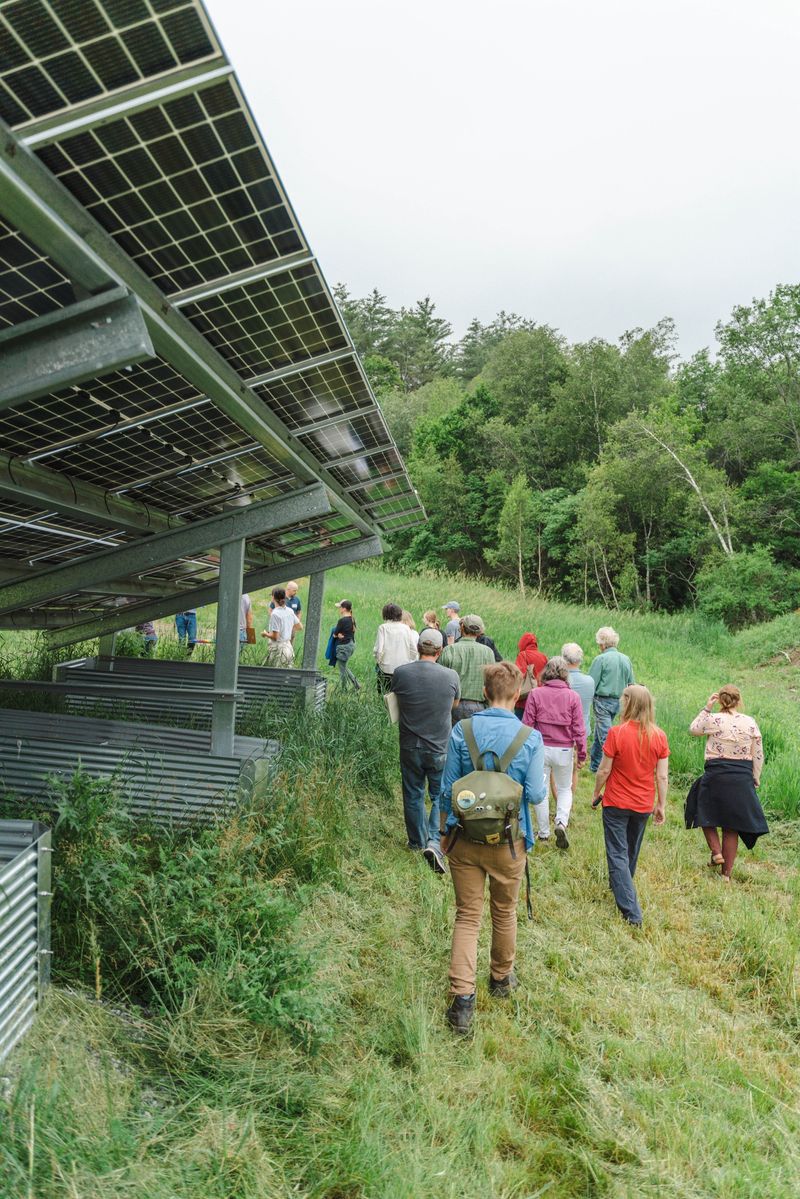
On the Ground
-p-800.avif)
-p-500.avif)
.avif)
-p-500.avif)
-p-500.avif)
.avif)
Images courtesy UGEI and Renewables.Org. Images represent some of our projects, but not the full extent of projects underway.
Building Dyme
March 2023
Venture Funding Secured
Raised a venture round with investors including Clocktower Ventures and GlobalX to build the platform.
June 2023
Gift Cards Launch
Launched gift cards from over 100 merchants, with funding for solar projects built into every purchase.
December 2023
First Solar Investment
Made our first solar investment with UGEI, Canada — the start of real-world clean energy impact.
January 2024
10 Million Employees Reached
Signed distribution deals making Dyme available to over 10 million US employees through their benefits platforms.
February 2024
Second Solar Investment
Expanded our solar portfolio with a second investment through partner Renewables.org.
August 2024
Blackhawk Networks Partnership
Launched green gift cards with Blackhawk Networks and over 16 major retail merchants.
June 2025
Dyme Travel Goes Live
Launched the travel platform with access to 2 million hotels and 600 airline partners worldwide.
November 2025
5.5 MW Solar Funded
Funded 5.5 MW of solar projects in the Global South — enough to power 710 homes for 30 years.
Join Dyme
Every booking funds clean energy for schools and hospitals. Save money while making a difference.
Start Exploring →