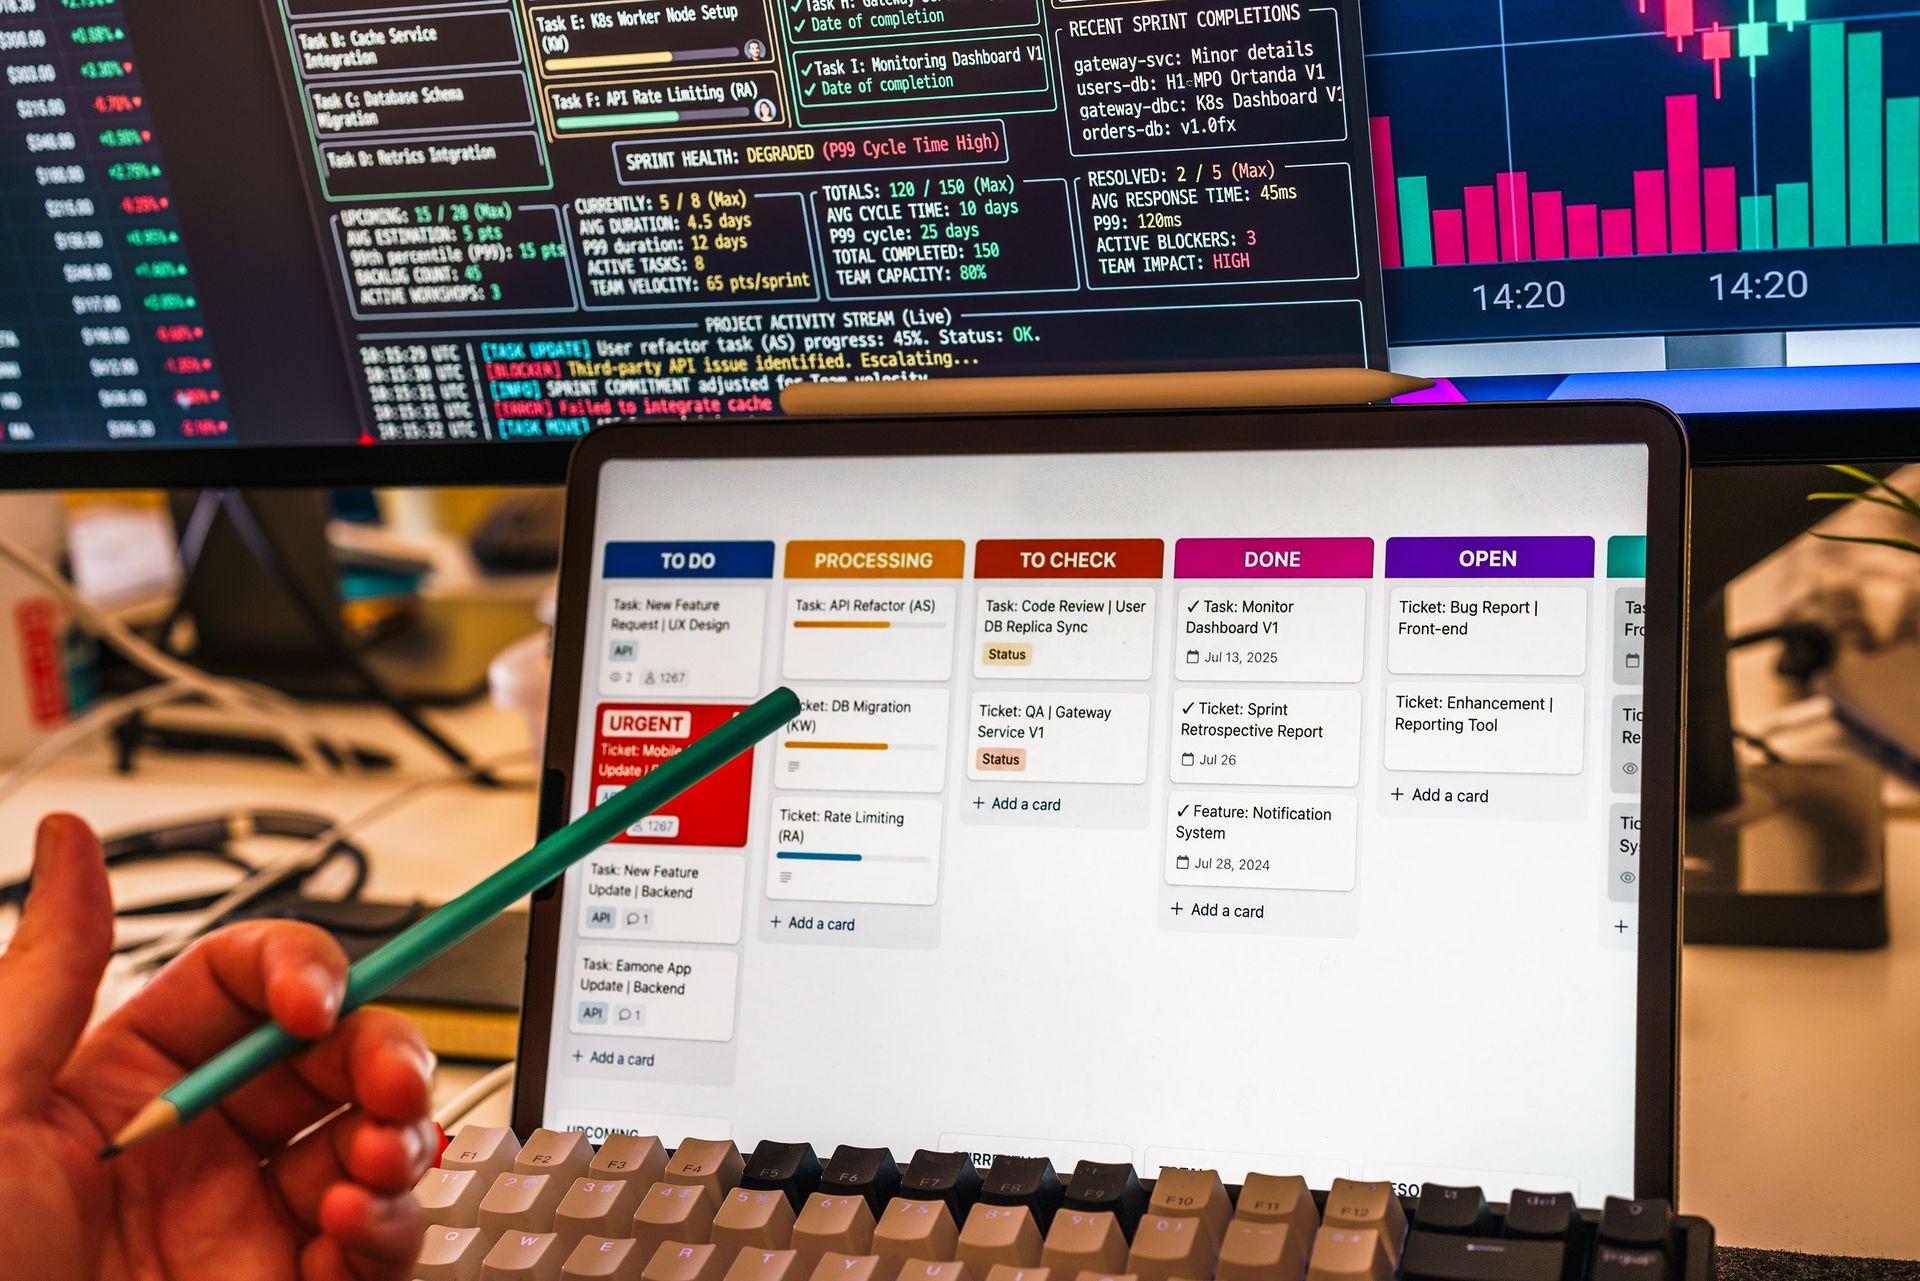
Two companies can run the same trips through the same booking tool, report their business travel emissions to the same standard, and publish numbers that differ by a third. Neither is lying. They made different choices about what the dashboard counts, and nothing on the dashboard says so.
This guide covers what belongs on a corporate travel dashboard across four domains, where each number comes from, and the specific places two honest dashboards diverge.
The four domains, and why one dashboard rarely covers them
Travel programs get judged on spend, emissions, policy compliance and whether the people doing the traveling can stand it. Those numbers live in different systems and arrive on different clocks, which is the practical reason most companies end up with three dashboards and a spreadsheet.
Spend comes from your booking tool and your card feed, and the two disagree until someone reconciles them, which is its own discipline covered in managing corporate travel expenses. Emissions are calculated from itinerary data, usually by your booking provider, using a factor set you did not choose. Emissions tracking tools differ widely in how much of that they show you. Compliance is a rules engine reading against a policy document. Traveler experience comes from surveys and support tickets, which is to say it arrives late and in prose.
The clocks matter more than they sound. Card data settles days after the trip, emissions get recalculated when a factor set updates, and a refunded booking rewrites history in the spend feed but often not in the emissions feed. A dashboard that shows all four as though they were measured on the same day will quietly disagree with itself.
Spend: pick one source and name it
The useful spend metrics are cost per trip, advance booking window, and the share of spend booked in channel. The last one is the diagnostic. Spend booked outside your tool is spend you cannot see, cannot negotiate against, and cannot put an emissions figure on, so a dashboard reporting 96 percent compliance on 60 percent of spend is reporting on a fraction of the program.
Decide early whether the dashboard reports booked value or settled value. Booked is faster and moves when trips change. Settled matches finance and lands late. Both are defensible and mixing them is not, so put the choice on the dashboard where a reader can see it.
Emissions: the boundary is a choice, and it is usually invisible
Business travel emissions are Scope 3 Category 6 under the GHG Protocol Corporate Value Chain Standard. The standard defines the category as emissions from transporting employees in vehicles owned or operated by third parties, and it draws several lines that decide what your total contains.
The line most people never see: hotels. The standard says companies "may optionally include emissions from business travelers staying in hotels." Optional means two providers can both follow the standard and report different totals for identical travel, and the one excluding accommodation will look better. When you compare a vendor's emissions figure against your incumbent's, check this first, because it can account for the whole gap.
Two further boundaries are worth confirming in writing:
- Commuting is a different category. Travel between home and worksite is Category 7, not Category 6. A dashboard folding commuting into business travel is inflating the number it reports.
- Your Category 6 figure includes the transport company's own emissions. The standard is explicit that a reporting company's business travel emissions include the Scope 1 and Scope 2 emissions of the airlines and rail operators carrying its people.
Then ask which factor set produced the number and from which year. Emission factors are revised, and a factor quietly held at an old value flatters every subsequent year. Any provider should be able to name the source and the vintage without checking. India's Central Electricity Authority, to take one published set, revises its CO2 Baseline Database annually. We publish ours, along with the arithmetic, in how we calculate Dyme's renewable energy impact.
Compliance: rate alone tells you almost nothing
A compliance rate is a ratio of bookings that matched policy to bookings made, and on its own it mostly measures how loose the policy is. Two additions make it diagnostic.
Report exceptions by reason rather than by count. Twelve exceptions for late booking is an approvals problem. Twelve exceptions because no in-policy hotel had availability is an inventory problem, and no amount of reminding travelers about policy will fix it.
Report the out-of-policy cost delta as well as the rate. A program running 80 percent compliance where the exceptions cost slightly more than policy is healthier than one at 95 percent where the exceptions are extravagant, and the rate alone inverts that reading.
Traveler experience: the metric that predicts the others
This is the domain most dashboards skip, and skipping it makes the other three harder to interpret. Compliance falls when the compliant option is painful, so a compliance problem is often an experience problem showing up one system downstream.
Three measures are cheap to collect and hard to game: time from booking request to confirmation, support tickets per hundred trips, and a one-question post-trip rating with a free-text box. The free text is where you find out that the in-policy hotel is a forty-minute commute from the office, which is the sort of thing that shows up in your exception report a quarter later.
An implementation checklist
- Write down the spend source and whether the figure is booked or settled. Put it on the dashboard, not in a data dictionary nobody opens.
- Confirm in writing whether hotel emissions are included. This is the single largest source of unexplained variance between two providers' numbers.
- Confirm commuting is excluded from the business travel figure and reported separately if at all.
- Record the emission factor source and vintage, and re-check it annually. Note when a restatement happens so year-over-year comparisons stay honest.
- Add in-channel booking share next to compliance rate, so nobody reads a high rate on a small denominator as a healthy program.
- Break exceptions out by reason, with at least the categories of timing, availability and price.
- Add one traveler-experience measure before adding a ninth spend metric.
- Timestamp every panel with the date its underlying data settled, so the reader knows which numbers are still moving.
None of this requires new tooling. It requires deciding what each number means and writing that decision somewhere the reader of the dashboard can find it.
FAQ: travel dashboards and reporting boundaries
Are hotel stays included in business travel emissions?+
Under the GHG Protocol Corporate Value Chain Standard, including them is optional. The standard says companies may optionally include emissions from business travelers staying in hotels, which means two providers can both comply and report different totals for the same trips. Ask any provider directly whether accommodation is in their figure, because it is a common and invisible source of difference.
Is employee commuting part of business travel emissions?+
No. The GHG Protocol puts travel between home and worksite in Scope 3 Category 7, separate from business travel in Category 6. If a dashboard combines them, the business travel number is overstated relative to how the standard defines it, and it will not compare cleanly against anyone else's.
What is the most useful single metric on a travel dashboard?+
The share of spend booked in channel. It is the denominator under most of the other numbers, and a program with substantial off-channel booking has compliance, emissions and cost figures that describe only the visible portion. Fixing visibility usually improves every other metric without changing policy at all.
Why do two travel emissions reports disagree for the same trips?+
Usually one of three reasons: whether hotels are included, which emission factor set was used and from what year, and whether the calculation runs on booked or flown itineraries. All three are legitimate choices and none is normally shown on the dashboard, so ask for all three in writing before comparing providers.
How often should a travel dashboard be updated?+
Match the refresh to the slowest input rather than the fastest. Spend can update daily, but if emissions recalculate monthly and survey data arrives quarterly, a daily dashboard shows three different vintages side by side. Timestamp each panel with when its data settled so nobody compares a live number against a stale one.